South Florida’s $1M-plus home sales rise as September closings fall
MIAMI REALTORS + RWorld reports million-dollar sales rose 20.2% year to date through September, while monthly single-family and condo closings declined. County and property-type results show an uneven market.
Key Takeaways
- •Million-dollar sales rose 20.2% year over year through September and 7.6% in September alone.
- •September single-family sales fell 5.2% and condo/townhome closings fell 5.1% across the five-county report area.
- •Miami-Dade had 123 active single-family listings below $400,000 at month-end, 3% of that inventory.
South Florida’s $1 million-plus housing market kept growing through September even as single-family and condo closings weakened. Million-dollar sales rose 20.2% year to date and 7.6% in September from a year earlier, according to a MIAMI REALTORS + RWorld report published Oct. 19. The figures measure transactions, not a 20.2% rise in home prices.
The September report covers Miami-Dade, Broward, Palm Beach, Martin and St. Lucie counties. Single-family closings fell 5.2%, and condo and townhome sales fell 5.1%. The report also lists an 8% drop in new pending sales for single-family homes and a 7.5% drop for condos and townhomes, signs that the monthly slowdown extended beyond completed deals.
The time frame also changes the picture. The report says year-to-date condo and townhome sales were 5.1% higher through September even as that segment’s September closings declined 5.1%. It gives two different figures for overall year-to-date sales growth, 5.1% in its key takeaways and 6.0% in the narrative, so this article does not use an aggregate year-to-date number.
The tri-county picture varied by property type. Single-family sales fell 4.7% year over year in Miami-Dade, 7.1% in Broward and 2.7% in Palm Beach County. Condo and townhome closings were nearly flat in Miami-Dade, up 0.6%, but down 12.5% in Broward and 4.3% in Palm Beach County. Those differences matter for local brokers and buyers because the regional headline does not describe every county or segment equally.
At the top of the market, sales priced at $10 million or more reached 407 through September, up 38.9% year over year, the report says. It describes that pace as potentially record-setting, but the 2026 calendar year is not complete. Cash accounted for 86% of the $10 million-plus transactions and 59% of million-dollar sales, compared with 42% of all sales. The larger cash share is a notable feature of the upper tier, though the report does not establish that it caused luxury sales to diverge from the wider market.
Million-dollar sales also made up different shares of each county’s transactions. The report puts Palm Beach County first at 29%, followed by Miami-Dade at 28% and Broward at 21%. Those figures are the share of sales at or above the million-dollar threshold, not the share of housing stock or the number of residents who can afford those homes.
The same report points to a tighter supply picture at lower price points. Active inventory across the five counties was down 13% from September 2025, its eighth straight monthly decline. Single-family homes listed below $400,000 represented 13% of that inventory regionwide. In Miami-Dade, the association counted 123 such listings at month-end, just 3% of the county’s active single-family inventory. The figure excludes condominiums and does not count homes already under contract.
The inventory split runs in both directions. The association says homes listed at $1 million or more made up 31% of active single-family inventory across the region. In St. Lucie County, 41% of single-family listings were below $400,000, underscoring how affordability and supply vary across the five-county report area. These are listing shares, not measures of completed sales or a guarantee that homes at a given price are accessible to every buyer.
For South Florida businesses, the numbers outline two different pressures: a continuing pool of high-value transactions and declining single-family and condo closings, alongside a limited supply of lower-priced single-family listings in Miami-Dade. The report offers a market snapshot, not a forecast for future sales or evidence about what is driving an individual buyer’s decision.
October’s monthly report will show whether the gap between the upper tier and the broader market persists. Until then, the September figures give developers, lenders and local service firms a county-by-county reference point, while buyers should distinguish transaction volume from prices and check current listings rather than infer availability from regional totals.
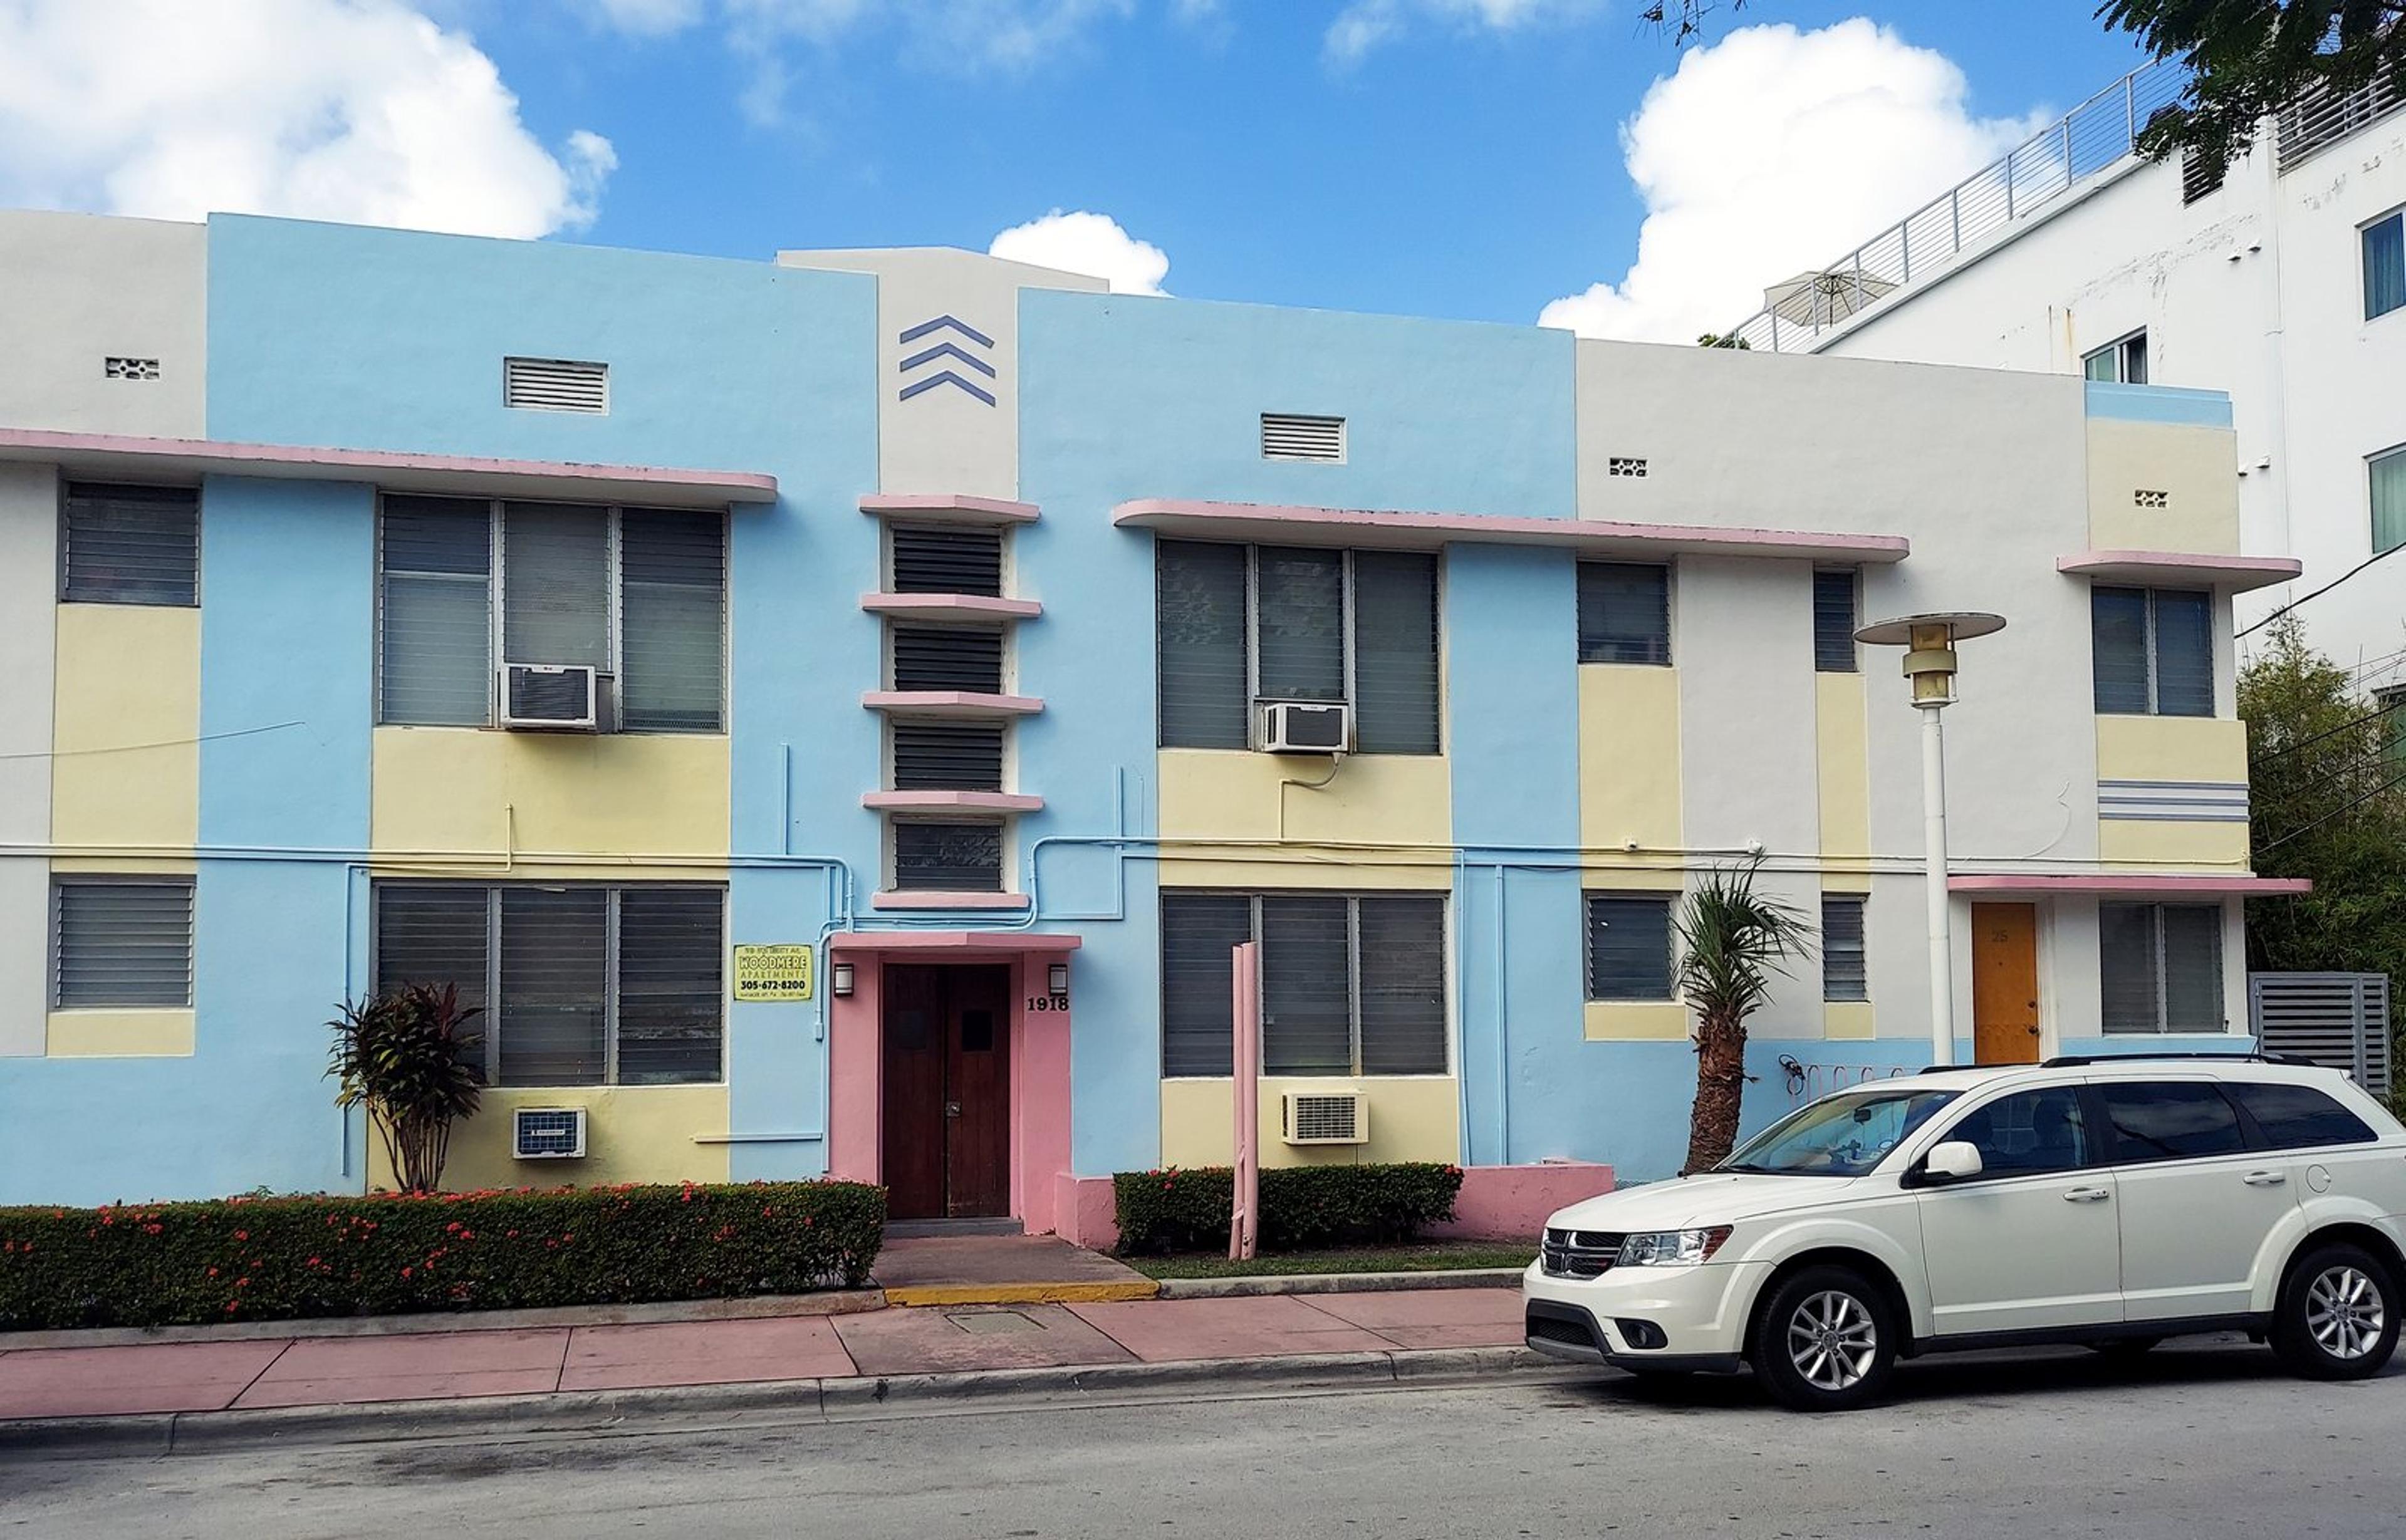
Photo: Apartment Building, 1918 Liberty Avenue, Miami Beach, Florida, P. Hughes (November 2024). Resized and lightly tone-adjusted. Licensed CC BY 4.0.